The Cost of the Silent Backlog
At 5:30 PM, the waiting room at Metro Medical Partners was dark, but the lights in the back offices remained on. Dr. Sarah Vance sat at her desk, staring at a screen filled with unresolved red notification badges. She had completed her last patient encounter ninety minutes earlier, yet her day was far from over.
Earlier that morning, a crucial specialist consult note had not arrived in time for an oncology follow-up, forcing Dr. Vance to spend fifteen minutes hunting down the document while the patient waited. At midday, an ambiguous prescription clarification request from a local pharmacy triggered a three-part volley of internal messages between the front desk, the triage nurse, and her workstation. By mid-afternoon, the practice fell thirty minutes behind schedule, a delay that snowballed into rushed patient interactions and an exhausted clinical staff.
To the practice’s billing software, today looked like a success; the scheduled volume was met, and the claims would be generated. But the hidden friction of the day told a different story.
Clinical communication efficiency metrics rarely sit next to accounts receivable and payer mix on a practice dashboard. Yet, they quietly account for a large share of every physician’s lost clinical time. A message sits in an inbox. A referral goes out, and nobody confirms it arrived. A phone rings for the fourth time about the same prescription refill. None of these events triggers an alarm, but together they define whether a physician group practice runs on schedule or runs behind.
For practice administrators, clinical communication efficiency is not a soft target. It is measurable, and the underlying data already exists inside the EHR, the phone system, and the referral workflow. The challenge is knowing which six numbers to pull, how outside benchmarks define acceptable performance, and where communication breakdowns quietly erode both clinical time and reimbursable revenue.
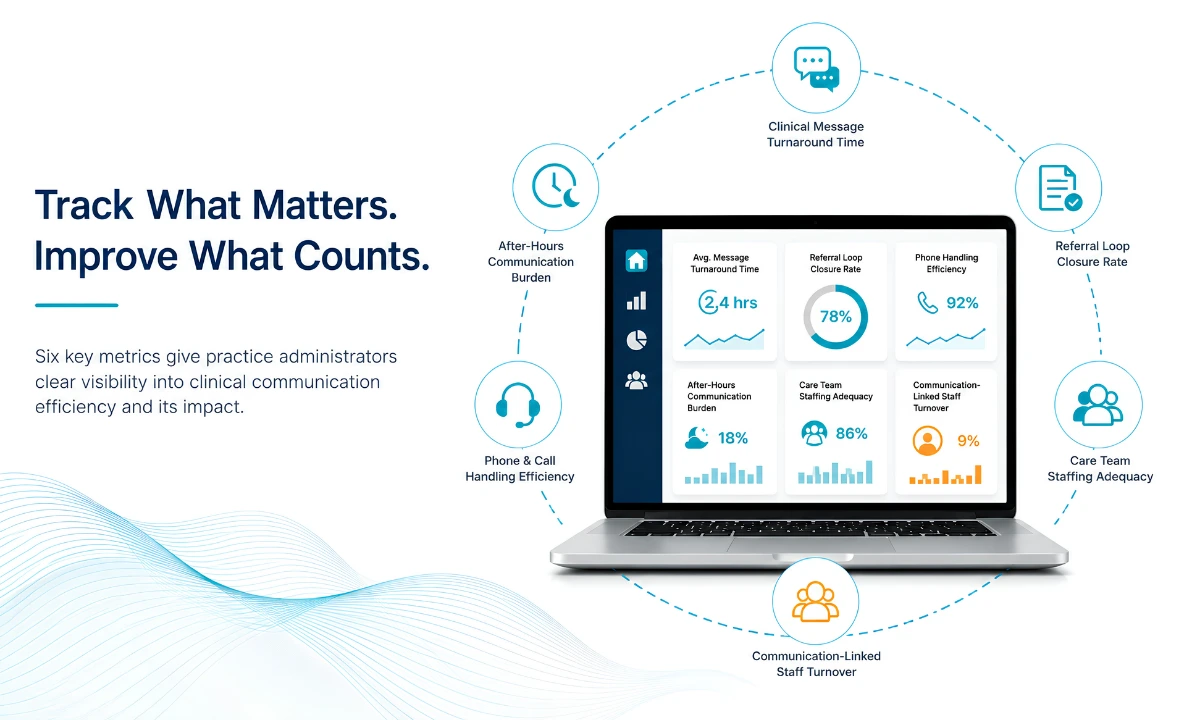
This guide walks through six clinical communication efficiency metrics that administrators at independent physician group practices can start tracking this quarter, along with the verified benchmark data for each.
Key Takeaways
- Primary care physicians spend roughly 85 minutes of every workday inside the EHR inbox alone, 23.7% of total EHR time (Sinsky et al., Annals of Family Medicine, 2016).
- Eligibility and prior authorization calls, not clinical questions, rank as the single most time-intensive phone workload, cited by 45% of practice leaders (MGMA Stat, 2026).
- Only 34.8% of referrals in a large multi-specialty analysis produced a documented, completed consult report back to the referring physician (Patel et al., J Gen Intern Med, 2018).
- Physicians who worked with an incompletely staffed care team more than a quarter of the time were over twice as likely to report burnout (AMA, 2025).
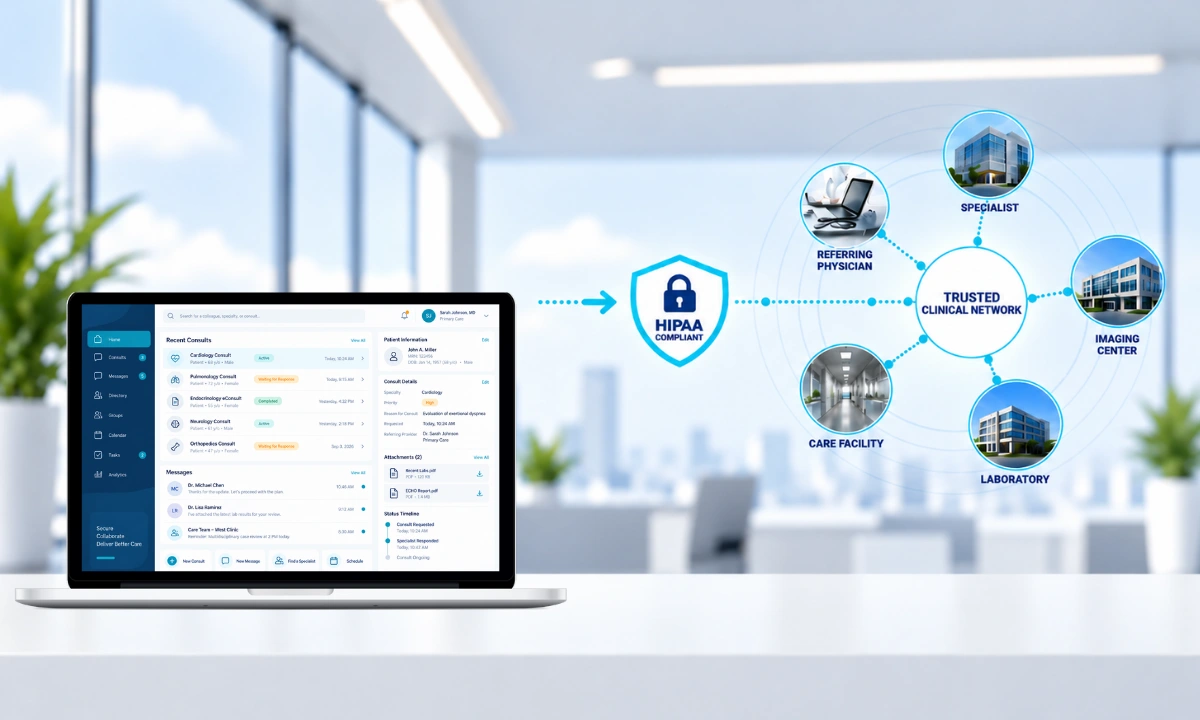
- ClinicianCore is a secure, HIPAA-compliant unified clinical communication platform built exclusively for physicians, built to surface these six metrics automatically rather than across five disconnected systems.
“Referral loop closure is the metric administrators don’t track, and physicians pay for it anyway.”

Why Clinical Communication Efficiency Metrics Matter for Practice Administrators
Independent physician group practices operate on tighter administrative margins than large health systems, which means every minute of unmeasured communication overhead compounds faster. A clinical communication efficiency metrics program does not need a data science team. It needs six specific, well-defined numbers pulled consistently, month over month, from systems the practice already owns.
Administrators who track these communication efficiency metrics gain a defensible basis for staffing decisions, technology purchases, and physician retention conversations, rather than relying on anecdote. The six metrics below span the physician’s clinical inbox, the front-desk phone queue, the referral pipeline, and the staffing conditions that connect all three. HCO Practice HQ, part of a secure, HIPAA-compliant unified clinical communication platform built exclusively for physicians, gives administrators a single source for most of this data; a spreadsheet pulled from separate systems works too, provided the definitions stay consistent quarter over quarter.
For a closer look at how fragmented tools create this overhead in the first place, see Intra-Office Communication Breakdown: How Fragmented Channels Create a Daily Tax on Physician Time.
Metric 1: Clinical Message Turnaround Time
What it measures: the elapsed time between a clinical message, patient portal inquiry, lab result flag, or staff note landing in a physician’s inbox, and documented response.
Clinical message turnaround time is one of the clearest clinical communication efficiency metrics for whether inbox load is manageable or compounding. In a widely cited time-motion study of primary care physicians, inbox management alone consumed 85 minutes of an 11.4-hour workday, 23.7% of total EHR time (Sinsky et al., Annals of Family Medicine, 2016). More recent data suggests message volume has only grown: primary care physicians in one large health system analysis received a mean of 77 inbox notifications per day, compared with 30 for specialists, while post-pandemic patient message volume has settled between 33 and 49 messages per physician per day at many practices (Journal of General Internal Medicine, 2024).
How to track it: Most EHR platforms log message-received and message-closed timestamps at the encounter level. Administrators should pull a rolling 30-day median turnaround time by message type, patient portal, staff-to-physician, and results notification, rather than a single blended average, since one slow category can hide inside an otherwise healthy overall number.
What a healthy range looks like: There is no single national benchmark for message turnaround time, which is precisely why practices should track their own trend line rather than chase an external target. A rising trend, or a turnaround time that regularly exceeds same-day resolution for non-urgent messages, is the signal administrators should act on before it surfaces as documented after-hours work.
Metric 2: After-Hours Communication Burden
What it measures: clinical communication and documentation work a physician completes outside scheduled clinic hours, commonly called pajama time.
After-hours communication burden converts inbox and message load into a measurable time figure. A cross-sectional study of 307 primary care physicians across 31 practices found that scheduled 30-minute visits generated a median of 36.2 minutes of total EHR time per visit, including 6.2 minutes of after-hours pajama time and 7.8 minutes on the EHR inbox specifically (American Medical Association, 2024, citing research published in JAMA Network Open). Put differently, the documentation and communication tail of a single visit routinely runs longer than the visit itself.
The same research found wide variation by clinic: median pajama time per visit ranged from 1.7 to 13.1 minutes depending on the practice, which tells administrators this metric is not fixed by specialty or physician habit. It is shaped by how communication is routed and triaged at the practice level.
How to track it: Pull EHR activity logs filtered to timestamps outside scheduled clinic hours (commonly before 7 a.m., after 6 p.m., and weekends), and report the figure as minutes per physician per week rather than a single monthly total, since week-to-week variation reveals coverage gaps faster than a monthly average does.
Why it belongs on an administrator’s dashboard: after-hours communication burden is one of the few clinical communication efficiency metrics that connects directly to physician retention. A practice that cannot see this number has no early warning before a physician begins reducing clinical hours or exploring another group. Tools built for unified clinical communication that consolidate video, voice, and text into a single triaged stream give administrators the activity log needed to isolate this metric by channel.
Metric 3: Phone and Call-Handling Efficiency
What it measures: call volume, hold time, abandonment rate, and the staff time consumed resolving each call type.
Phone work remains one of the largest, least-measured communication cost centers in an independent physician group practice. In a March 2026 poll of practice leaders, MGMA found that eligibility and prior authorization work, not clinical questions, ranked as the single most time-intensive category of phone work, cited by 45% of respondents, followed by scheduling at 31%, intake and registration at 9%, and prescription refills at 6% (MGMA Stat, 2026).
MGMA’s guidance to administrators is specific: measure call abandonment rate, time-to-resolution, staff minutes per call, the number of touches required to resolve a single request, and the size of after-hours message backlogs (MGMA Stat, 2026). Each of these is a distinct clinical communication efficiency metric, and each tends to move independently. A practice can show a low abandonment rate while still burning excessive staff minutes per call because of rework: callers who phone back three times because a policy number, a pharmacy name, or an insurance detail was missing the first time.
How to track it: Most practice phone systems and VoIP platforms log call duration, hold time, and abandonment natively. Administrators should segment this data by call reason, not just by line, since eligibility and prior authorization calls behave very differently from a routine scheduling call.
Why it connects to clinical communication, not just front-desk operations: a missed or mishandled call frequently becomes a physician-facing problem. An unanswered refill request escalates into a portal message, which escalates into a staff note routed to the physician’s inbox. Tracking phone efficiency separately from inbox efficiency hides this handoff. Pairing role-based alert routing with a Consult Core workflow keeps this escalation visible in the data instead of buried across separate call logs and inbox exports nobody reconciles.
Metric 4: Referral and Consult Loop Closure Rate
What it measures: the percentage of referrals or interprofessional consult requests for which the referring physician receives documented confirmation, typically a specialist’s note or consult report, that the loop closed.
Referral loop closure is arguably the clinical communication efficiency metric with the most direct financial and clinical consequence, and it is also the one most practices do not track at all. In a peer-reviewed analysis of 103,737 referral scheduling attempts across a large health system, only 36,072, or 34.8%, resulted in a documented, completed specialist appointment with a report returned to the referring physician (Patel et al., Journal of General Internal Medicine, 2018).
An open loop is not a paperwork problem. It means the referring physician makes the next clinical decision without knowing what the specialist found, and the practice has no record to support a billable interprofessional consult when one occurred informally, sometimes called a curbside consult.
How to track it: Pull a monthly report of referrals or consult requests initiated, cross-referenced against consult notes or reports received back within a defined window, commonly 30 to 45 days. Report the rate by specialty, since loop closure varies widely depending on how tightly the receiving specialist’s workflow is integrated with the referring practice.
How to improve it: structured, documented consult routing closes the loop by design rather than relying on fax follow-up or a phone call weeks later. A documented consult workflow built specifically for interprofessional collaboration converts what used to be an informal hallway conversation into a record the referring physician can see and the practice can bill against, addressing the clinical gap and the revenue gap in the same workflow.
Metric 5: Care Team Staffing Adequacy
What it measures: the share of clinical sessions a physician works with an incompletely staffed support team, and the corresponding burnout risk that creates.
Staffing adequacy is not usually filed under communication metrics, but it should be. A physician working without adequate support absorbs the communication tasks that staff would otherwise triage, which directly inflates every other metric on this list. In a study of 970 physicians across 15 organizations, nearly half reported working with an incompletely staffed team more than a quarter of the time, and those physicians were more than twice as likely to meet criteria for burnout (American Medical Association, 2025, citing research published in JAMA Internal Medicine). Overall, 47.9% of respondents in that study met burnout criteria, and 26.4% reported intent to reduce their clinical hours.
The pattern held across specialty, though unevenly: 62.4% of physicians in specialties such as radiology, anesthesiology, pathology, and radiation oncology reported understaffed sessions more than a quarter of the time, compared with 44.8% in primary care and 38.5% in medical specialties (American Medical Association, 2025).
How to track it: Most scheduling and staffing platforms already log whether a session ran at target staffing ratio. Administrators should report this as a percentage of physician sessions below target staffing per month, alongside the communication metrics above, rather than as a separate HR statistic, since the two move together.
Why it belongs next to the other five metrics: a practice cannot interpret a rising message turnaround time or a climbing after-hours burden in isolation. If staffing adequacy is falling at the same time, the communication numbers are a symptom, not the root cause.
Metric 6: Communication-Linked Staff Turnover
What it measures: the connection between staff turnover, particularly in front-desk, medical assistant, and referral coordination roles, and the communication breakdowns that follow.
Staff turnover is a workforce metric, but MGMA’s own analysis ties it directly to communication performance. In a May 2026 poll, 28% of medical group leaders reported higher staff turnover than the prior year, concentrated most heavily in medical assistants, front-desk and patient access staff, and revenue cycle roles (MGMA Stat, 2026). MGMA’s guidance to administrators is explicit about the downstream effect: each departure can slow rooming, age claims work, lengthen call queues, and increase overtime, while front-desk and patient access turnover specifically causes call abandonment to rise, scheduling accuracy to fall, and referral handoffs to lag (MGMA Stat, 2026).
This creates a measurable loop: rising communication overhead contributes to burnout and reduced clinical hours (Metric 5), which increases the workload on remaining staff, which drives the turnover MGMA’s data describes, which in turn degrades the communication metrics tracked in Metrics 1 through 4.
How to track it: Report quarterly turnover by role category, specifically front-desk, medical assistant, and referral coordination, rather than a single blended practice-wide turnover figure, since these roles carry the highest communication load per MGMA’s data.
Closing the loop on the dashboard: administrators who track all six clinical communication efficiency metrics together, rather than in separate departmental reports, get an early warning system rather than a quarterly surprise. That consolidated view is the operational case for a secure, HIPAA-compliant unified clinical communication platform built exclusively for physicians in the first place: message routing, call escalation, referral tracking, and staffing visibility reported in one place instead of five.
Building a Clinical Communication Efficiency Dashboard
Six clinical communication efficiency metrics will not fix a practice’s workflow by themselves, but they replace guesswork with a defensible, trackable baseline. Start with whichever metric is currently invisible; for most independent physician group practices, that is referral loop closure or after-hours pajama time, since both tend to be tracked nowhere until an administrator builds the report by hand.
ClinicianCore is a secure, HIPAA-compliant unified clinical communication platform built exclusively for physicians, and the HCC ROI Calculator gives administrators a starting estimate of what closing these gaps is worth annually. For a fuller framework connecting these six metrics to staffing and revenue decisions, review the Medical Practice Efficiency and the Healthcare Administration Communication Platform resource. Administrators building a fuller financial case can also pair these six metrics with the analysis in What Alert Fatigue is Costing Your Physician Group Practice: A Financial Model for Administrators.
Frequently Asked Questions
What are clinical communication efficiency metrics and why should practice administrators track them?
Clinical communication efficiency metrics are measurable indicators, such as inbox turnaround time and referral loop closure rate, that reveal whether a practice’s workflow is functioning well. Primary care physicians spend roughly 85 minutes daily on EHR inbox work alone (Sinsky et al., 2016), which is why ClinicianCore tracks this data by design.
How is clinical message turnaround time measured in a physician practice?
Clinical message turnaround time is measured as the elapsed time between a message reaching a physician’s EHR inbox and a documented response. Inbox management alone consumes 85 minutes of a typical primary care workday, 23.7% of total EHR time (Sinsky et al., Annals of Family Medicine, 2016). HCO Practice HQ logs this automatically.
What is a healthy referral loop closure rate for a physician group practice?
There is no single national benchmark for referral loop closure, but most practices fall well short of full closure. A peer-reviewed study of 103,737 referral attempts found only 34.8% produced a documented specialist report back to the referring physician (Patel et al., 2018). HCC Consult Core closes this loop by default.
How does phone call volume affect clinical communication efficiency in a medical practice?
Phone call volume affects clinical communication efficiency by consuming staff time that would otherwise triage messages before they reach a physician’s inbox. Eligibility and prior authorization calls, not clinical questions, ranked as the most time-intensive phone workload for 45% of practice leaders surveyed (MGMA Stat, 2026). Unresolved calls often become undocumented messages.
Can improving clinical communication efficiency metrics reduce physician and staff turnover?
Yes, because both share the same root cause: unmanaged communication load. Physicians working understaffed more than a quarter of the time were over twice as likely to report burnout, and 26.4% intended to reduce clinical hours (AMA, 2025). ClinicianCore’s routing tools target this exact load.
References
1. Sinsky C, Colligan L, Li L, et al. Allocation of Physician Time in Ambulatory Practice: A Time and Motion Study in 4 Specialties. Annals of Family Medicine. 2016. https://pmc.ncbi.nlm.nih.gov/articles/PMC5593724/
2. American Medical Association. Primary care visits run a half hour. Time on the EHR? 36 minutes. 2024. https://www.ama-assn.org/practice-management/digital-health/primary-care-visits-run-half-hour-time-ehr-36-minutes
3. American Medical Association. Five physician specialties that spend the most time in the EHR. 2024. https://www.ama-assn.org/practice-management/digital-health/five-physician-specialties-spend-most-time-ehr
4. Assessment of EHR Efficiency Tools and Resources Associated with Physician Time Spent on the Inbox. Journal of General Internal Medicine. 2024. https://www.ncbi.nlm.nih.gov/pmc/articles/PMC11436598/
5. MGMA. Phones are still a bottleneck costing medical practices time they can’t afford. MGMA Stat. March 11, 2026. https://www.mgma.com/mgma-stat/phones-are-still-a-backlog-costing-medical-practices-time
6. MGMA. Stabilized but not solved: Staff turnover in medical practices looking no better, no worse in 2026. MGMA Stat. May 28, 2026. https://www.mgma.com/mgma-stat/stabilized-but-not-solved-staff-turnover-in-2026
7. American Medical Association. When health care teams run short, physician burnout rises. 2025. https://www.ama-assn.org/practice-management/physician-health/when-health-care-teams-run-short-physician-burnout-rises
8. Patel MP, Schettini P, O’Leary CP, et al. Closing the Referral Loop: An Analysis of Primary Care Referrals to Specialists in a Large Health System. Journal of General Internal Medicine. 2018. https://pubmed.ncbi.nlm.nih.gov/29532299/